Place Value Chart
Hundred millions to ones · Blank
Created for free at puzzleandprint.com
Every column named and grouped into periods, and empty rows to write any number in.
Last updated
Save this to PinterestPlace Value Chart
Hundred millions to ones · Blank
Created for free at puzzleandprint.com
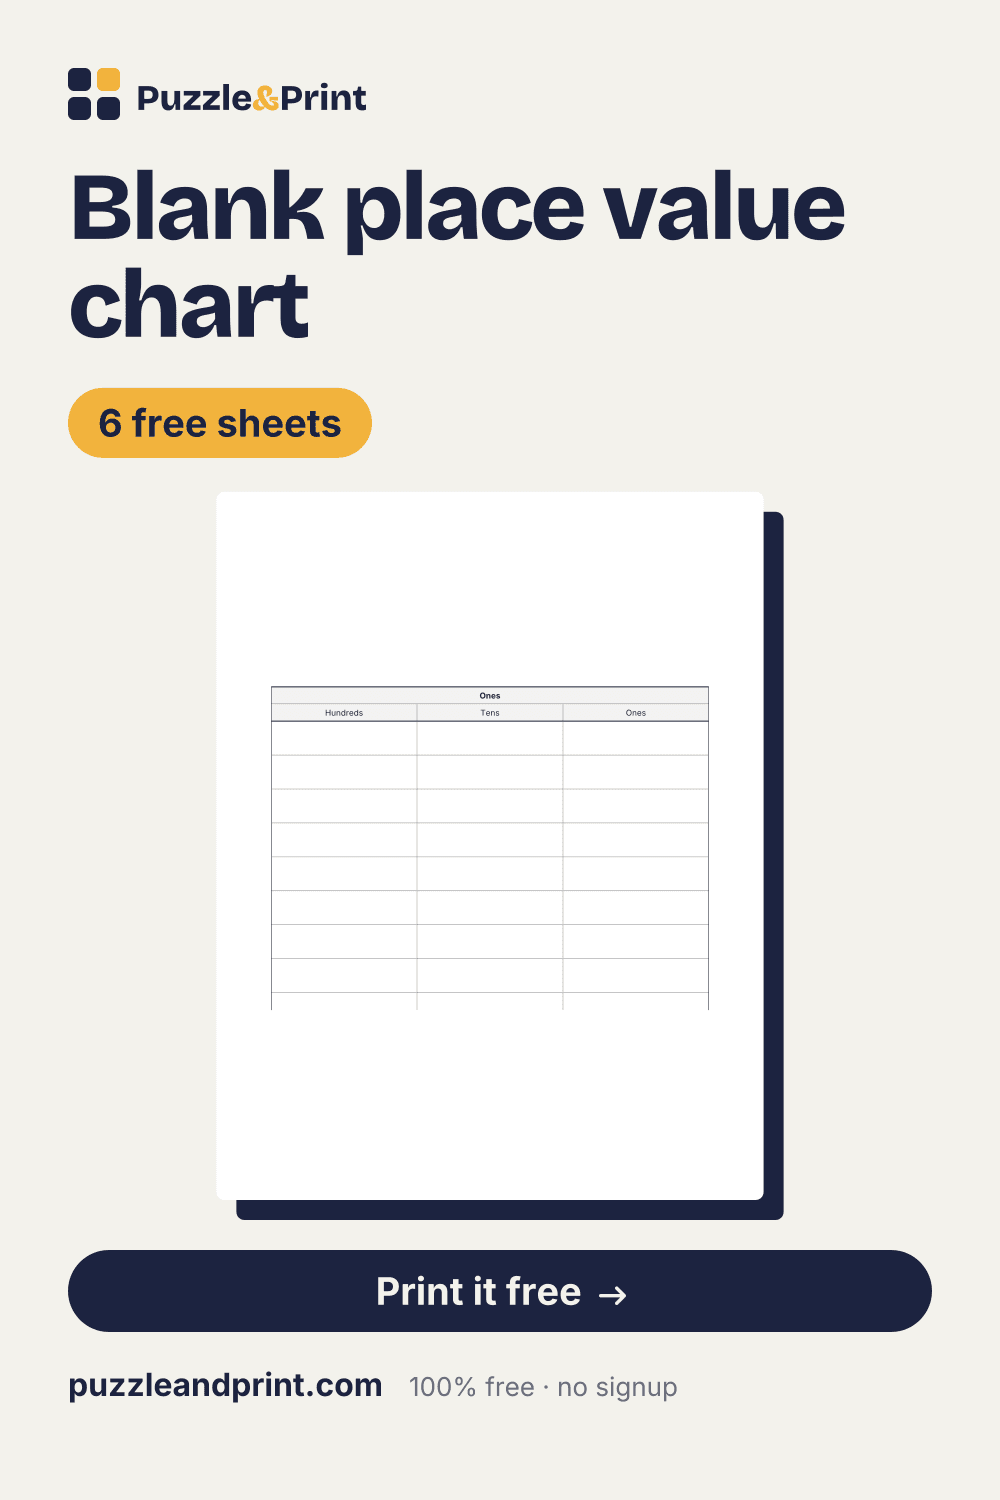
6 charts, each a one-page PDF with nothing on it to check.
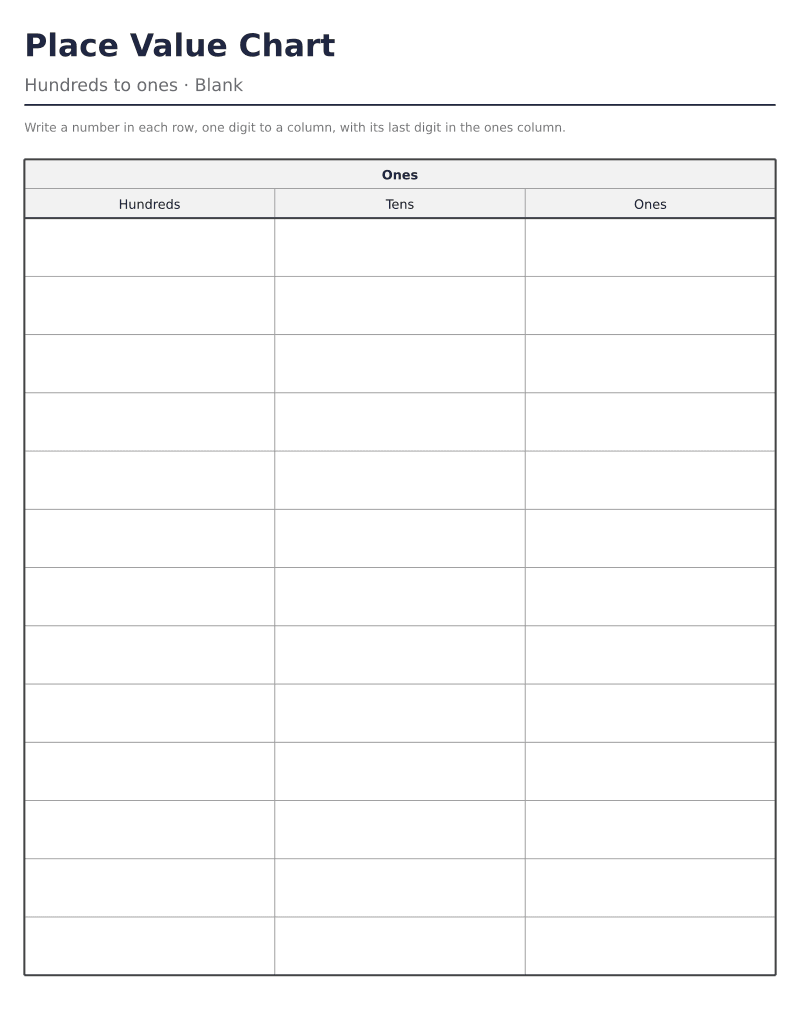 Blank place value chart, hundreds, tens and ones3 columns · 13 empty rowsDownload PDF ↓
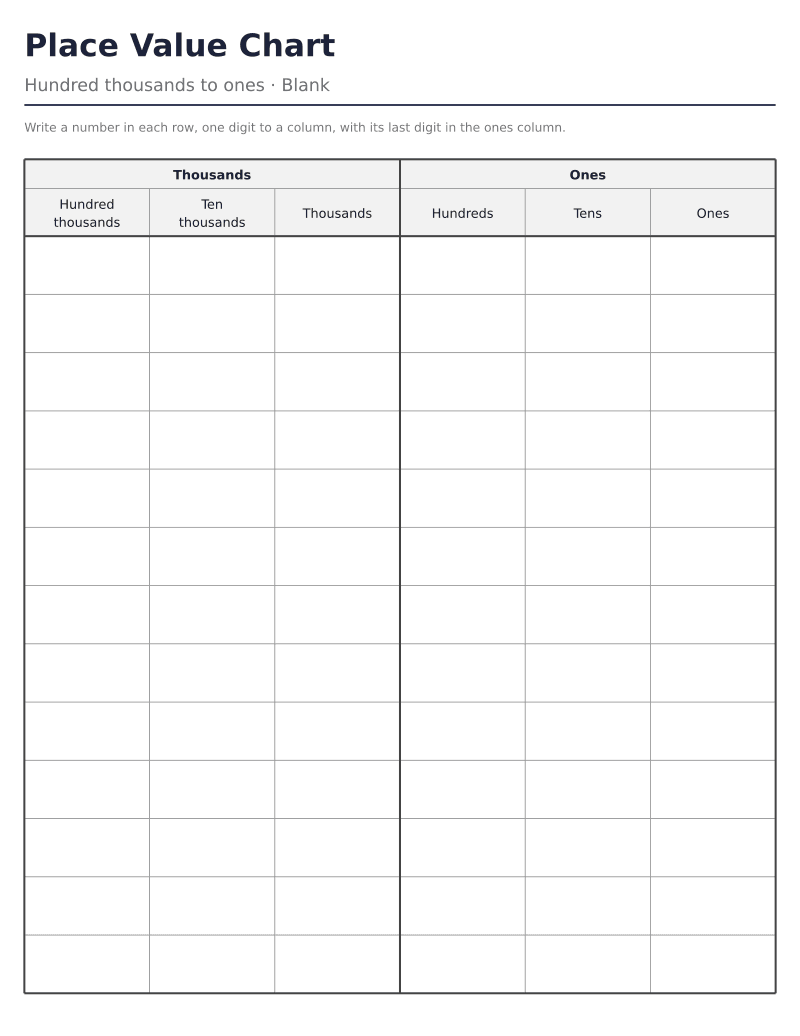 Blank place value chart to thousands6 columns · 13 empty rowsDownload PDF ↓
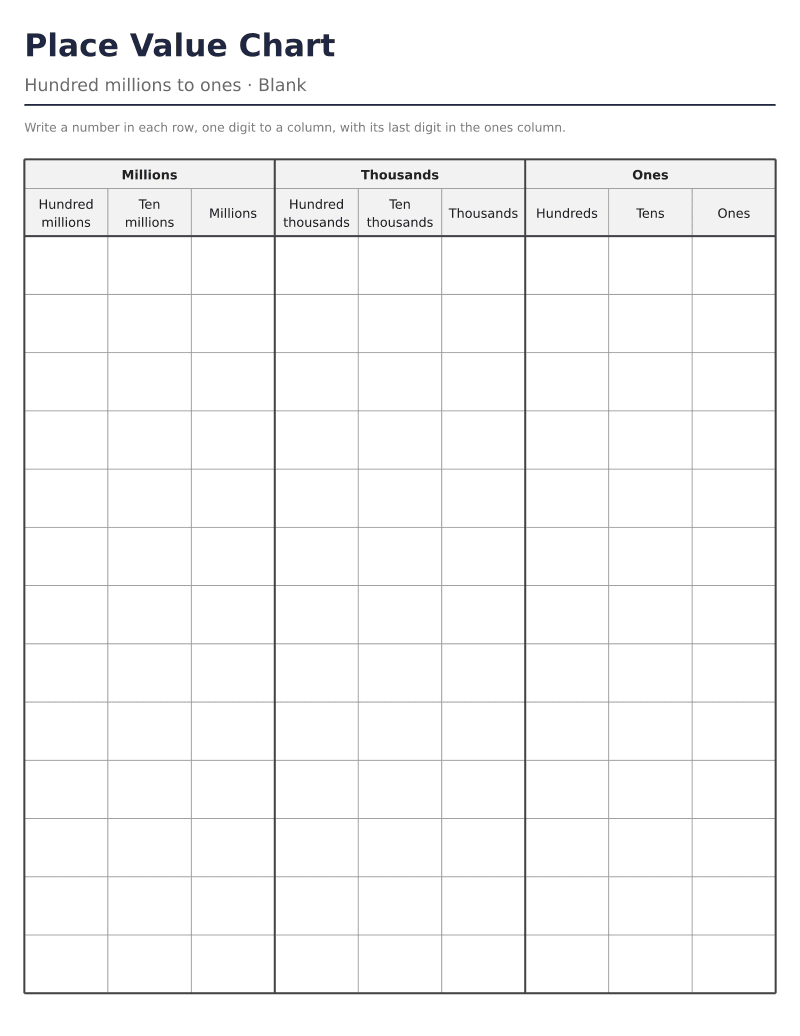 Blank place value chart to millions9 columns · 13 empty rowsDownload PDF ↓
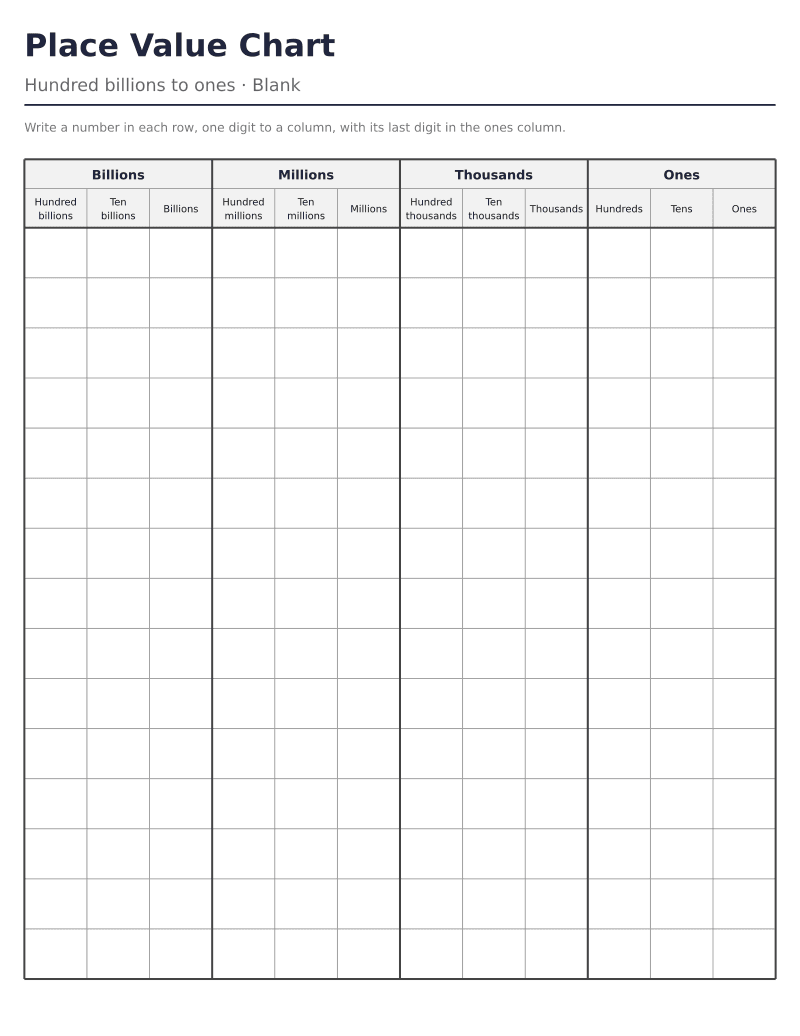 Blank place value chart to billions12 columns · 15 empty rowsDownload PDF ↓
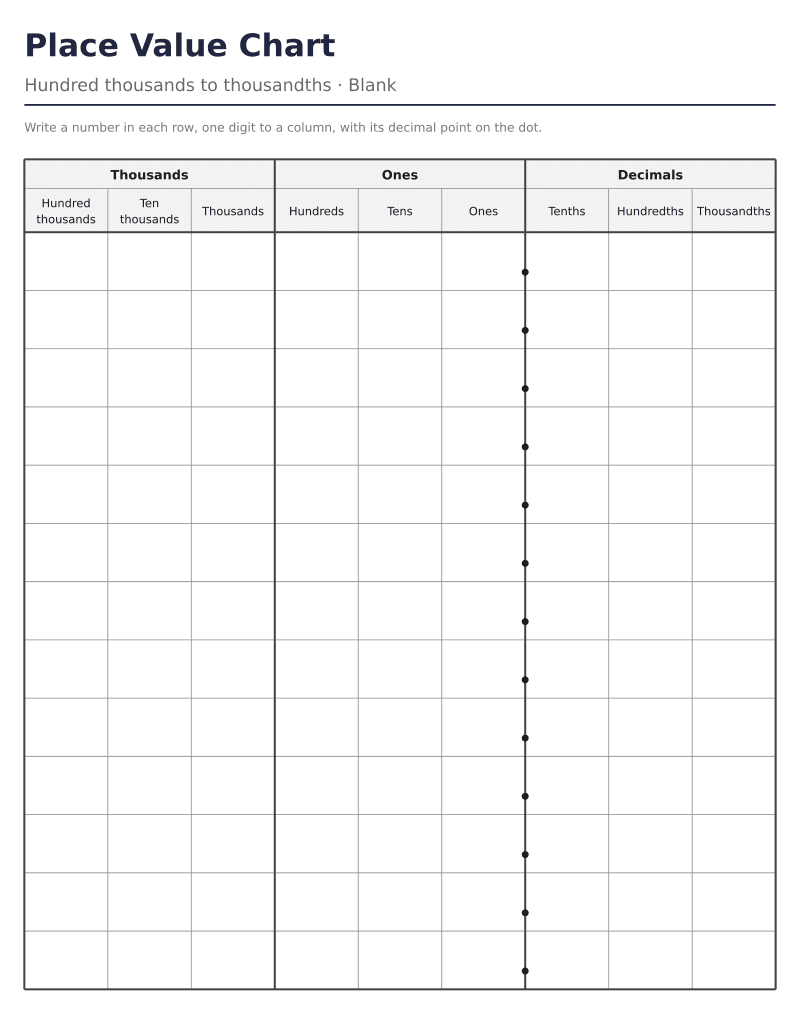 Blank place value chart to thousandths9 columns · 13 empty rowsDownload PDF ↓
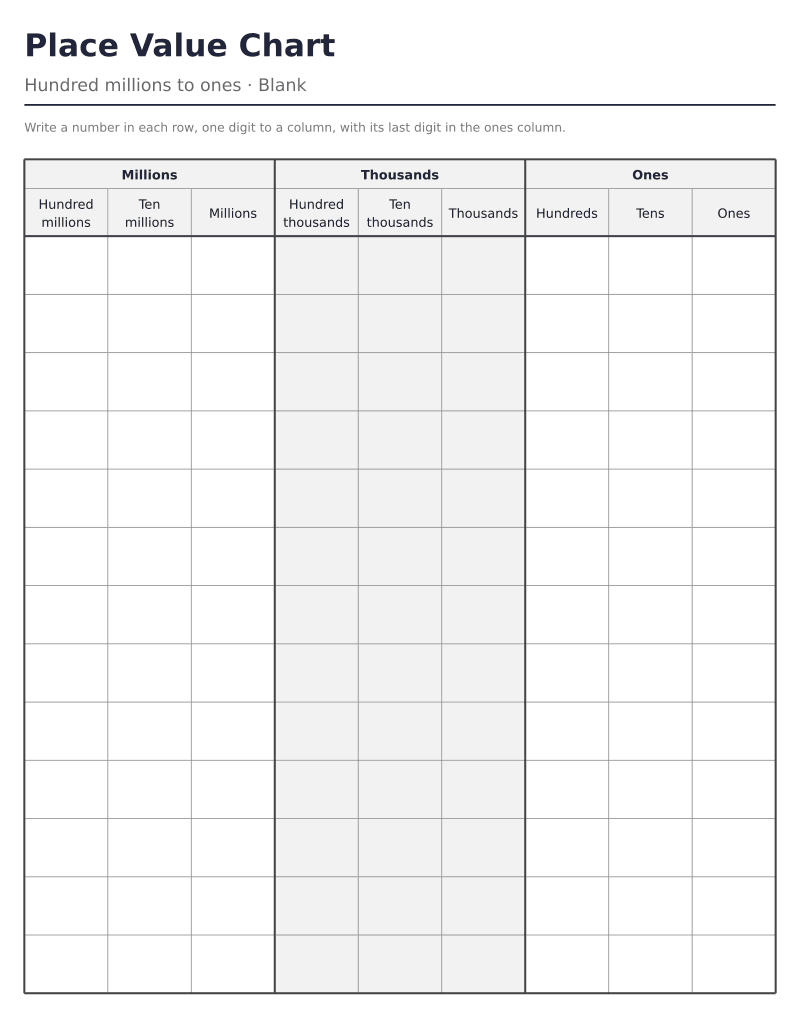 Blank place value chart with shaded periodsTo millions · thousands shaded · 13 empty rowsDownload PDF ↓
Every sheet here is free to print as often as you like. If one saved you time, the tip jar is on Ko-fi.
A blank place value chart prints the frame of the chart and leaves the numbers out: the period names across the top, the name of every place under them, and empty rows below for numbers to be written in one digit to a column. It is the chart for a lesson where the numbers come from the board, a dice game or a textbook page, and the one to slide into a sheet protector and use again and again with a dry-erase marker.
There are six ready-made sizes. Hundreds, tens and ones is three wide columns, for second grade. The chart to thousands has six columns, from hundred thousands down to ones, the chart to millions nine and the chart to billions twelve. The chart to thousandths runs from hundred thousands across the decimal point to thousandths in nine columns, with the point printed as a dot on the line in every row. The last sheet is the chart to millions with the thousands period shaded light gray, so the three groups of three stand apart at a glance.
Every chart is 182 mm wide, so the columns narrow as the chart grows: about 61 mm each on the hundreds, tens and ones chart, 30 mm to thousands, 20 mm to millions and 15 mm to billions. On these six sheets the rows are 14.1 mm tall, 13 to a page, except on the twelve-column chart, where they are 12.1 mm and there are 15. A blank chart has nothing to check, so it prints alone, with a line for a name and the date above it.
The maker above opens on the blank chart to millions. It can add tenths, hundredths or thousandths to any chart but the one to billions, shade every other period, set the grid lines faint, normal or strong, and switch to a filled reference chart or a practice sheet with its own key.
Read a number aloud and have it written into the chart, then read the next one: dictation is the quickest check of whether a child hears where the periods fall, and fourteen thousand, six becomes 14,006 only if the zeros go in. Roll a die once for each column and write the digits in as they come, then rearrange them into the largest and smallest numbers they can make, one to a row. Or put two numbers in neighboring rows and compare them column by column from the left.
A sheet slid into a clear sheet protector takes a dry-erase marker and wipes clean, so one printed chart can serve a whole unit. For a class, print the size the lesson needs: the hundreds, tens and ones chart has three columns about 61 mm wide, room for a young child's large digits, while the chart to billions has twelve columns about 15 mm wide, still wide enough for a digit written in pencil.
Match the chart to the largest number in the lesson and no further. Empty columns at the left of a chart are not wrong, but a child faced with nine columns for a four-digit number spends attention on columns that will stay empty. The chart to thousands covers every number up to 999,999 in six columns; the chart to millions adds hundred millions, ten millions and millions; the chart to billions carries all twelve places.
The shaded sheet is the chart to millions with the thousands period washed in light gray, which leaves three bands, white, gray and white, one for each period. On a long number it keeps the eye inside one group of three, which is exactly the group read aloud before the period's name. The maker can shade the thousands and the billions the same way on any chart that has them, and on a chart with decimals it shades the decimal places too, so the point sits at the edge of a gray band.
Hundreds, tens and ones for second grade, where the numbers go to 1,000. The chart to thousands for third and fourth grade, which reaches hundred thousands, and the chart to millions once numbers pass a million. The chart to thousandths suits fifth grade decimals, and the chart to billions is for older students or anyone who wants every period on one page.
No. A blank chart has no numbers of its own, so there is nothing on it to check, and it prints as a single page. For numbers to place with a key, use the practice sheets: ten numbers listed above an empty chart, and on the next page the same chart with every number written in.
Yes. Any chart up to hundred millions can carry tenths, hundredths or thousandths, and the ready-made blank chart with decimals runs from hundred thousands to thousandths in nine columns, with 13 empty rows. The decimal point is printed as a dot on the line between the ones and the tenths in every row.
New printables when they go up, mostly seasonal, a few times a year.