Multiplication Chart
1 to 12
Created for free at puzzleandprint.com
The filled 1 to 12 chart, ready to print, plus blank charts and fill-in practice charts with plain answer keys.
Last updated
Make your own chartEach is a PDF on US Letter. The filled charts are a single page; the blank chart and the Monday to Friday set carry an answer key after each chart.
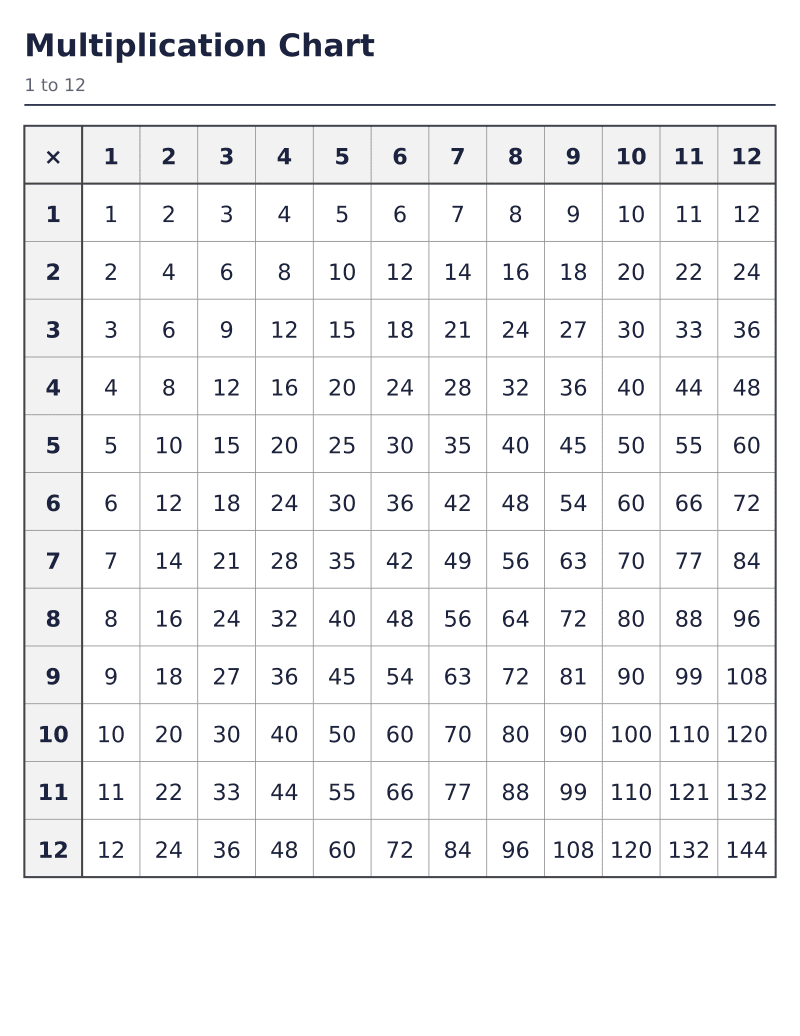 Multiplication chart 1 to 12144 products · 14 mm squaresDownload PDF ↓
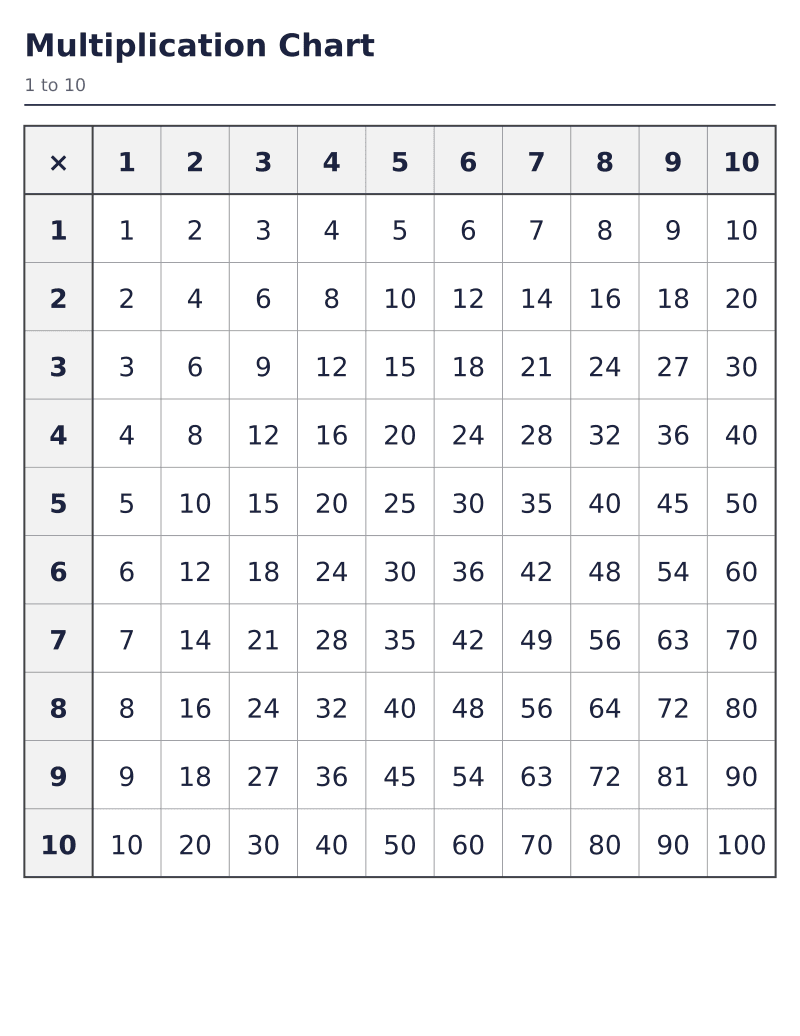 Multiplication chart 1 to 10100 products · 16.5 mm squaresDownload PDF ↓
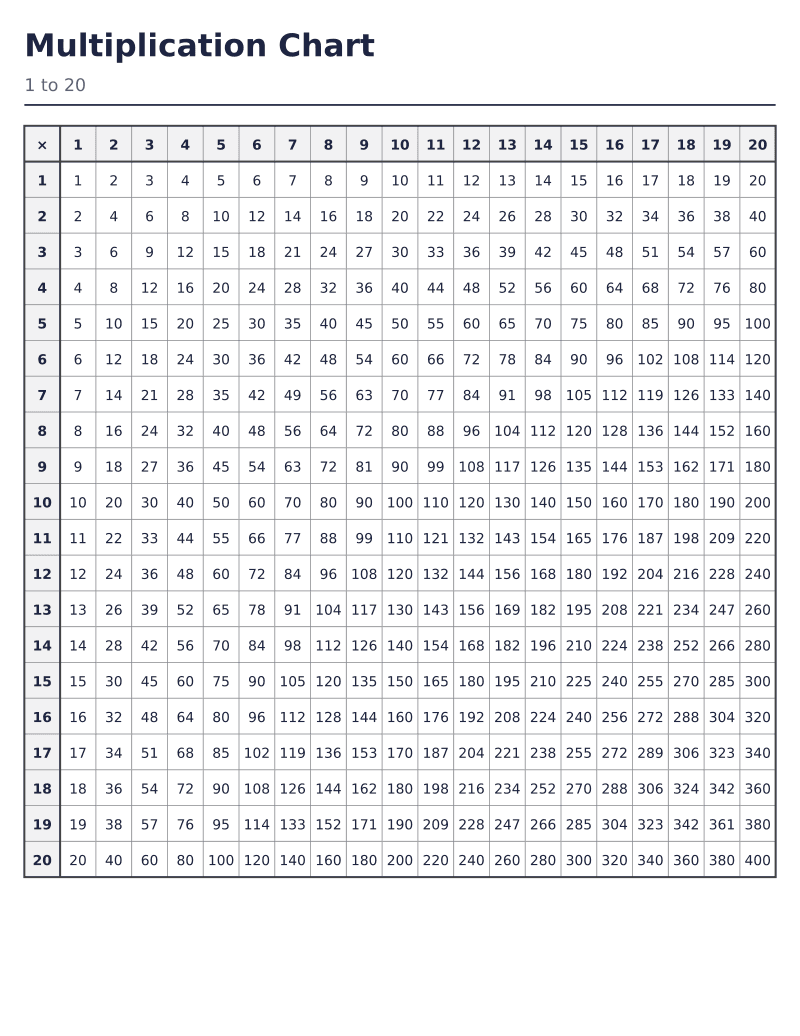 Multiplication chart 1 to 20400 products · 8.7 mm squaresDownload PDF ↓
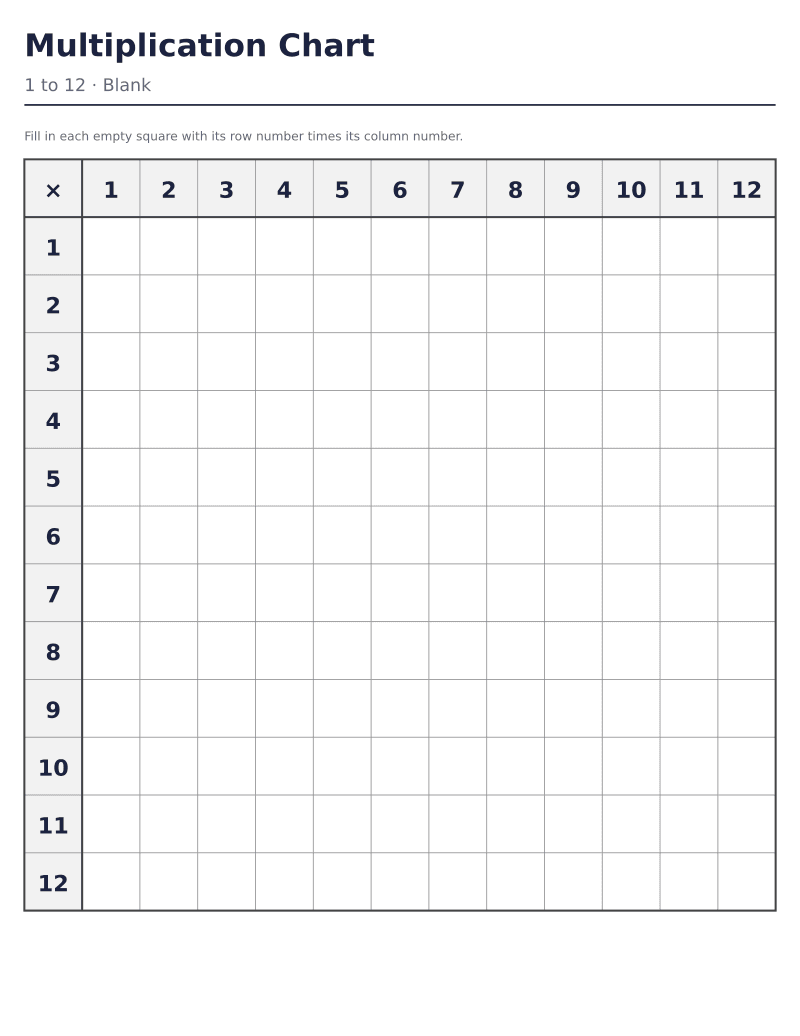 Blank multiplication chart 12x12144 squares to fill · answer keyDownload PDF ↓
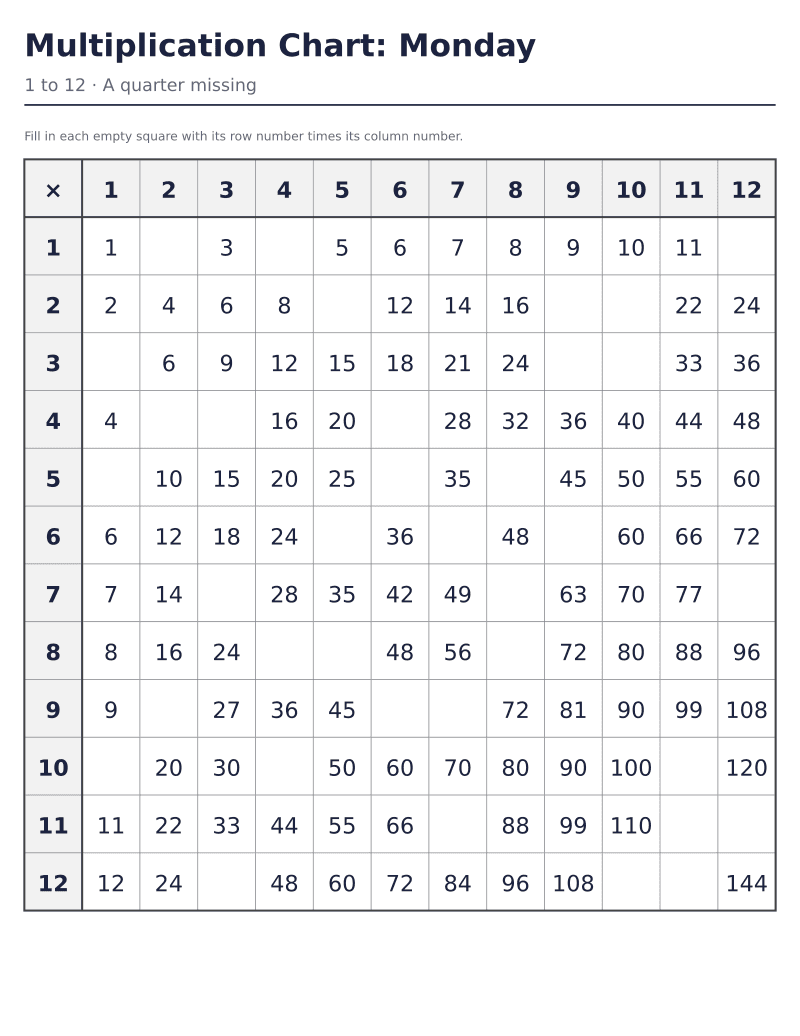 Fill-in multiplication charts Monday to Friday5 different charts, each with its keyDownload PDF ↓
Every sheet here is free to print as often as you like. If one saved you time, the tip jar is on Ko-fi.
Multiplication Chart
1 to 12
Created for free at puzzleandprint.com
The filled chart is one US Letter page: a title, the range under it, and the grid. The numbers being multiplied run along the top row and down the left column in bold, on a faint gray wash, with a heavier rule fencing them off from the products, and the times sign sits in the corner where the two meet. Every product is printed in near black in its own square, and nothing on the page is in color.
Every range prints at the same width, 182 mm or a little over seven inches, so the squares shrink as the range grows: 16.5 mm across on the 1 to 10 chart, 14 mm on the 1 to 12, 13 mm on the 0 to 12, 11.4 mm on the 1 to 15 and 8.7 mm on the 1 to 20. The type is sized to the longest number on the chart, so on the 1 to 20 chart 4 and 400 print at the same size, about 11 point, rather than the small products looming over the large ones.
The grid lines print in gray at one of three weights, faint, normal or strong, the same three the graph paper maker uses. Faint suits a chart that will be written on; strong survives a photocopier.
A fill-in chart prints the factors and some of the products and leaves the rest of the squares empty. Random gaps come in three amounts, a quarter, half or three quarters of the products, and they are spread evenly rather than scattered: on the 1 to 12 chart every row and every column has exactly 3 empty squares at a quarter, 6 at half and 9 at three quarters, so no table is left full and none is emptied. On a range whose rows do not divide evenly, each row and column is within one of the rest.
The other gaps follow a pattern. Leaving out the square numbers empties the diagonal, the twelve squares from 1 × 1 to 12 × 12. Leaving out everything above the diagonal empties the 66 squares to the upper right of it, every one a fact printed below it the other way around, 7 × 3 below for 3 × 7 above. Leaving out one table empties a single row and its matching column, 23 squares on the 1 to 12 chart, crossing at the table's own square.
Every fill-in and blank chart comes with its answer key on the next page unless you switch it off. The key is the chart again with every square written in, the printed numbers in near black and the answers in a lighter gray, so whoever is marking can see which squares were the child's. Like every key on this site it prints plain, with no border, to save ink. A filled chart has no key, since there is nothing on it to check.
A random fill-in chart is made from a seed, so the maker can make another with different gaps whenever New charts is pressed, and the versions setting puts up to five of them in one PDF. Each version is a different chart from the same settings and each is followed by its own key, so a set of five prints as ten pages: chart, key, chart, key.
That is the Monday to Friday set among the ready-made charts at the top of this page. Monday and Tuesday have a quarter of the products missing, Wednesday and Thursday half, and Friday three quarters, so the week ends with the chart three quarters empty. The patterned fill-ins and the filled and blank charts are the same chart every time, so the maker does not offer versions for those; the copies box in the print dialog does that job.
A filled multiplication chart is a reference, and the patterns on it are worth pointing out to a child before it goes on the wall. Each row and its matching column hold the same numbers, because 4 × 7 and 7 × 4 are one fact. The diagonal holds the square numbers. And of the 144 products on the 1 to 12 chart only 59 are different numbers, because a number like 24 can be made several ways: 2 × 12, 3 × 8, 4 × 6 and each of those turned around.
Looking a fact up is not the same as knowing it, though. The Common Core asks third graders to know from memory every product of two one-digit numbers, and recall comes from practice with nothing to count along, which is what the shuffled times tables drills on this site are for. A sensible order is the filled chart for reference, a fill-in chart once the patterns are understood, and drills once the chart is coming back right.
Each page has five ready-made charts to print, plus the maker above opened on that kind of chart.
Yes. Every chart at the top of this page and every chart the maker makes is free to download and print as often as you like, at home or for a whole class. There is no sign-up, no email address to give and no watermark on the chart.
One US Letter page, with the grid 182 mm, about 7.2 inches, wide whatever the range. On the 1 to 12 chart that makes each square 14 mm across. The grid also fits on A4 printed at 100%, since A4 is 210 mm wide and taller than Letter.
No, it is black and white, with a faint gray wash behind the factors along the edges and a slightly deeper gray behind any squares you choose to shade, the square numbers or one table. That keeps a class set cheap to print, and the chart reads just as well from a black and white photocopier.
Choose Fill-in, then One table under Leave out, and pick the table: its row and its column print empty, 23 squares on the 1 to 12 chart, and everything else stays filled in as a guide. To show a table rather than test it, keep the chart filled and choose One table under Shade, which tints the same row and column light gray.
A blank chart prints only the numbers along the top and the left side, so every product is written in by hand, 144 of them on the 1 to 12 chart. A fill-in chart prints some of the products as a guide and leaves out the rest, anywhere from the 12 squares of the diagonal to three quarters of the chart, 108 squares. Both come with an answer key.
Yes. The ranges are 1 to 10, 1 to 12, 0 to 12, 1 to 15 and 1 to 20. The 1 to 20 chart holds 400 products, up to 20 × 20 = 400, in squares 8.7 mm across with every number set at the same size, about 11 point, and the filled 1 to 20 chart is one of the ready-made sheets at the top of this page.
New printables when they go up, mostly seasonal, a few times a year.