Multiplication Chart
1 to 12 · Half missing
Fill in each empty square with its row number times its column number.
Created for free at puzzleandprint.com
Times table charts with gaps to fill, each with its own plain answer key.
Last updated
Save this to PinterestMultiplication Chart
1 to 12 · Half missing
Fill in each empty square with its row number times its column number.
Created for free at puzzleandprint.com
Multiplication Chart, Answer Key
1 to 12 · Half missing
Created for free at puzzleandprint.com
Five charts, each a two-page PDF: the chart, then its answer key on a page of its own.
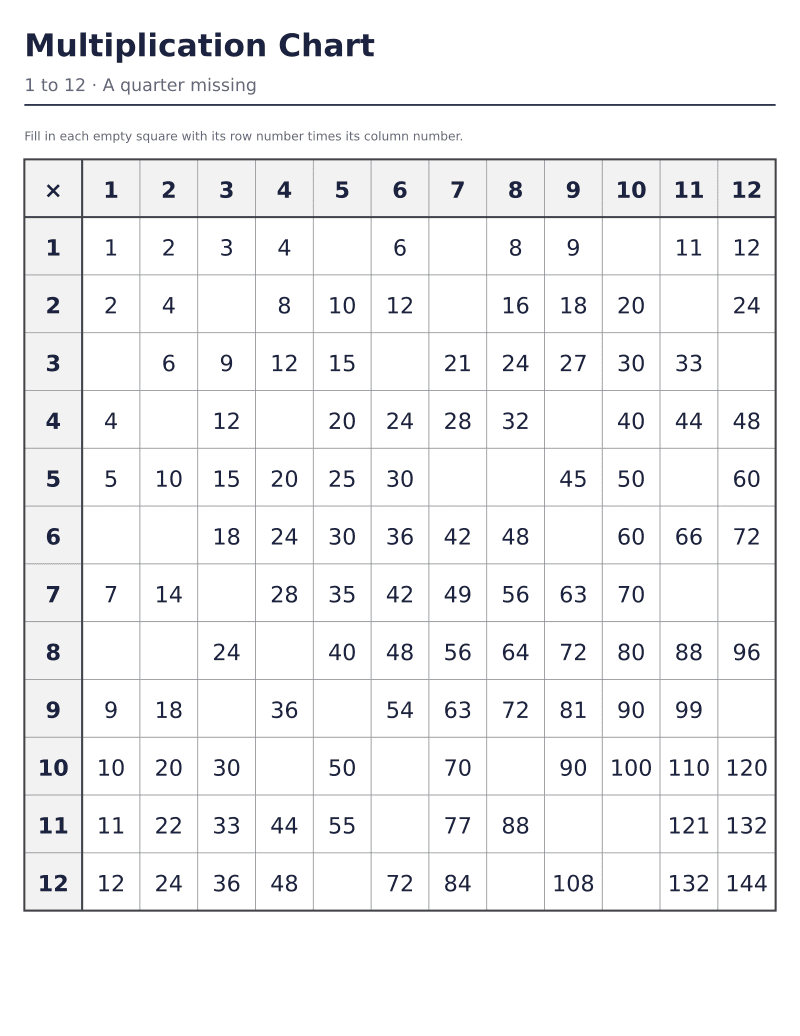 Fill-in multiplication chart, a quarter missing1 to 12 · 36 of 144 empty · answer keyDownload PDF ↓
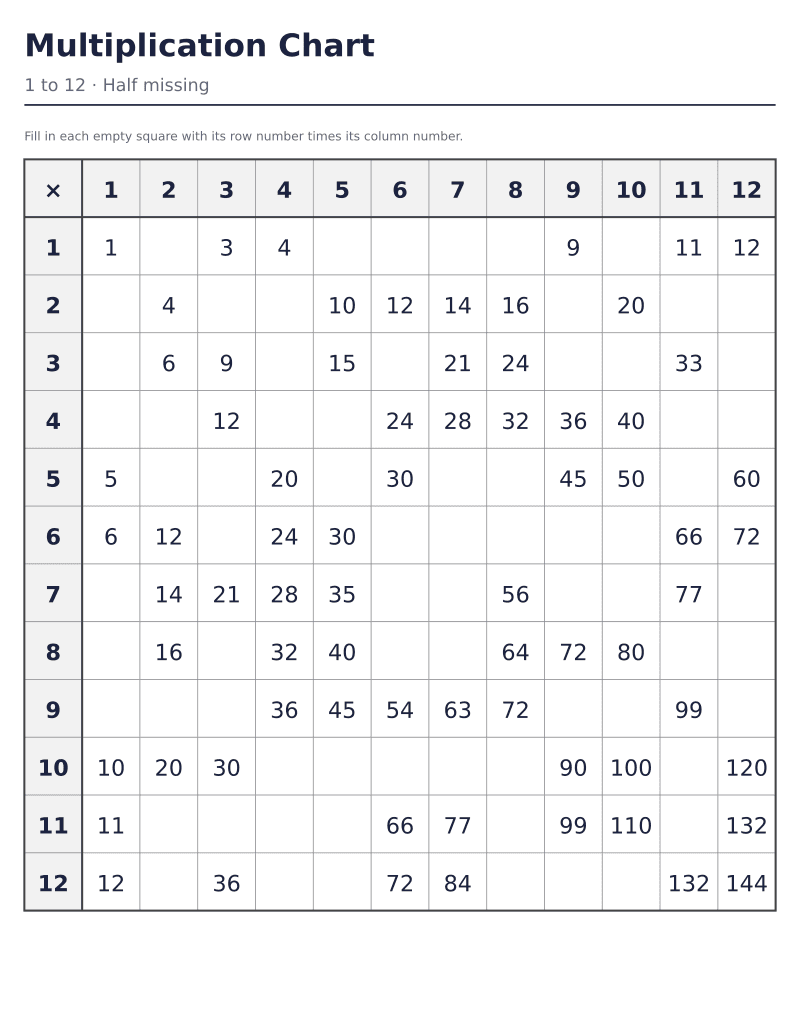 Fill-in multiplication chart, half missing1 to 12 · 72 of 144 empty · answer keyDownload PDF ↓
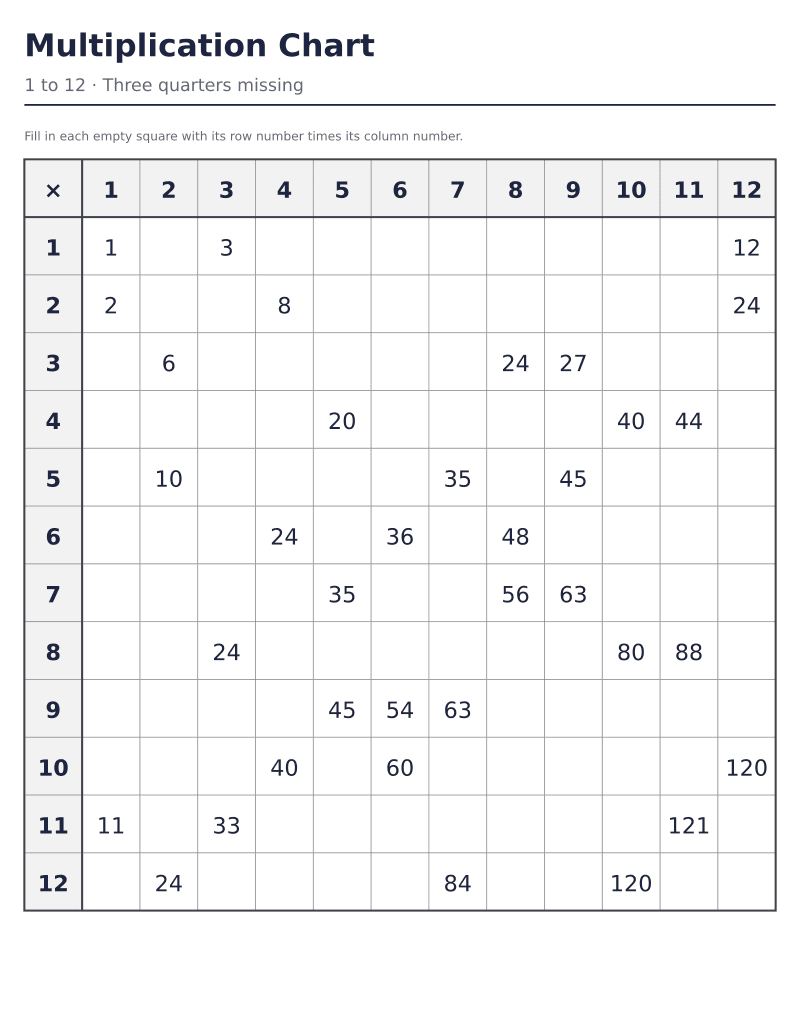 Fill-in multiplication chart, three quarters missing1 to 12 · 108 of 144 empty · answer keyDownload PDF ↓
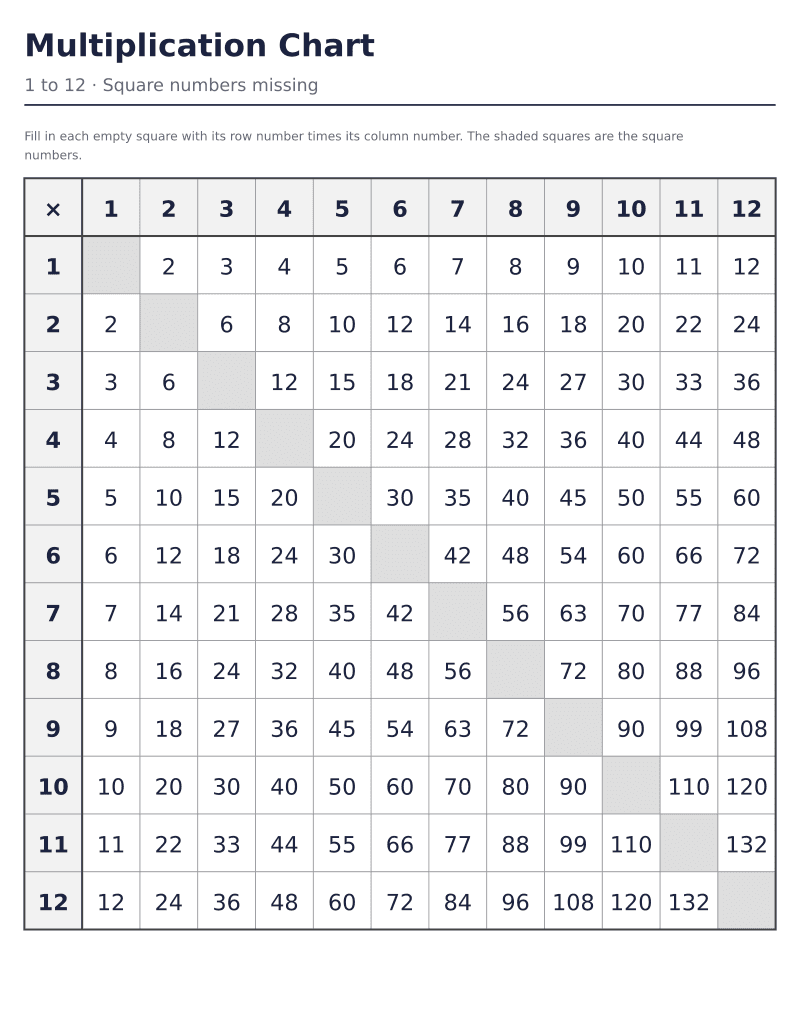 Fill-in multiplication chart, square numbers1 to 12 · the 12 shaded diagonal squares emptyDownload PDF ↓
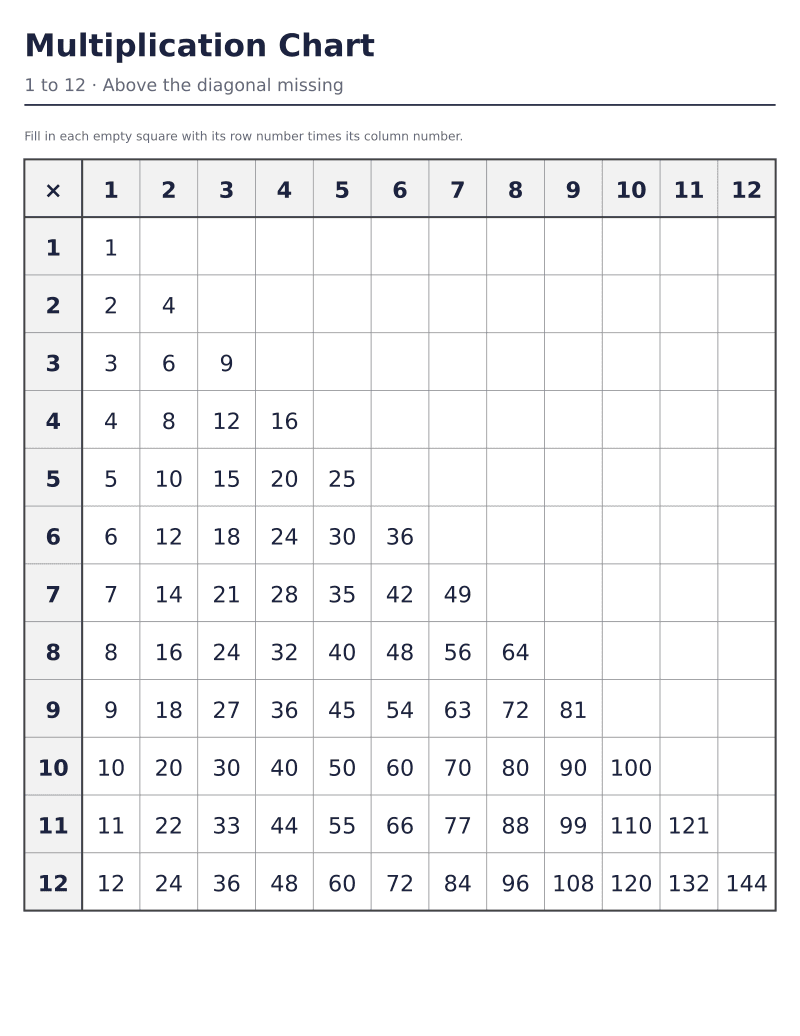 Fill-in multiplication chart, above the diagonal1 to 12 · 66 turnaround facts emptyDownload PDF ↓
Every sheet here is free to print as often as you like. If one saved you time, the tip jar is on Ko-fi.
A fill-in multiplication chart sits halfway between a chart to look at and a page of times table problems. The factors run along the top and down the side as usual, some of the products are printed as a guide, and the rest of the squares are left empty. Filling one in asks for the same recall a drill does, but with the structure of the chart in view, so a child stuck on 7 × 8 can look along the row for a printed neighbor, 7 × 7 or 7 × 9, and count on or back by seven.
The five ready-made sheets are all 1 to 12 charts. Three leave out products at random, 36, 72 or 108 of the 144, spread so that every row and every column has the same number of gaps: 3, 6 or 9. The fourth leaves out the diagonal, the twelve square numbers from 1 × 1 to 12 × 12, and shades those squares light gray so they are easy to find. The fifth leaves out the 66 squares above the diagonal, every one a fact that is printed below it the other way around.
Each sheet has its answer key on the next page: the same chart with every square written in, the answers in a lighter gray than the printed numbers, so the squares to check stand out. The keys print without a border, as every key on the site does, so the teacher's copy costs as little ink as the student's.
The maker above opens on the half-missing chart. It can leave out one table's row and column instead, shade the square numbers or one table, switch to any range from 1 to 10 up to 1 to 20, and put up to five different random charts in one download, each followed by its own key.
The random gaps on these charts are spread evenly rather than scattered. A plain random pick of 36 squares out of 144 can leave one row with six gaps and the next with none, and at three quarters missing it can empty a row completely, so the chart would test some tables and skip others. Instead every row is given the same share of gaps first, and within each row the gaps go to the columns that have had the fewest so far, with ties settled at random.
On a 1 to 12 chart the shares come out exact: 3 gaps in every row and every column at a quarter, 6 at half and 9 at three quarters. On a range whose rows do not divide evenly, such as the 1 to 10 chart at a quarter, where 25 gaps go into 10 rows, each row and each column gets two or three. Within those limits the pattern is different on every seed, so the five versions in one download are five different charts, each with its own key.
The answer key prints the chart with every square filled, the printed products in near black and the answers in a lighter gray, so the squares to check stand out from the ones that were already there. Going along the key row by row is quickest, and a wrong answer often belongs to a pattern: a run of answers along one row that are each seven too many usually means the child counted on by seven from a wrong start, while a single wrong square is usually one fact to practice.
The chart offers a second check that needs no key at all. Each row and its matching column hold the same numbers, so the empty square at row 6, column 8 must match row 8, column 6, and if one of the pair was printed the other can be checked against it. On the square numbers sheet the diagonal is shaded, and its twelve squares are the only ones on the chart with no partner across the diagonal, because each is a number times itself.
Start with a quarter missing, 36 of the 144 products, which leaves three gaps in every row and every column and plenty of printed facts to count on from. Move to half when the quarter sheet comes back right, and to three quarters, 108 empty squares, once most facts are recalled rather than worked out, since by then only three products are printed in each row.
Because they are the same facts as the squares below it, turned around: 3 × 7 above the diagonal is 7 × 3 below it, and both are 21. A child filling in the 66 empty squares can read each answer off the lower half, and doing it makes the point that the 144 products on a 1 to 12 chart are really 78 facts, the 66 pairs and the 12 square numbers on the diagonal.
Yes. In the maker on this page, choose One table under Leave out and pick the table: its row and its column print empty, 23 squares on a 1 to 12 chart, crossing at its own square, and the other 121 products stay printed as a guide. The answer key fills in the 23.
New printables when they go up, mostly seasonal, a few times a year.