Place Value Chart
Hundred millions to ones
Created for free at puzzleandprint.com
The filled chart to millions, ready to print, plus charts to billions and with decimals, blank charts, and practice sheets with plain answer keys.
Last updated
Make your own chartEach is a one-page PDF on US Letter. The filled charts carry an example number with its forms below; the blank chart has empty rows to write in.
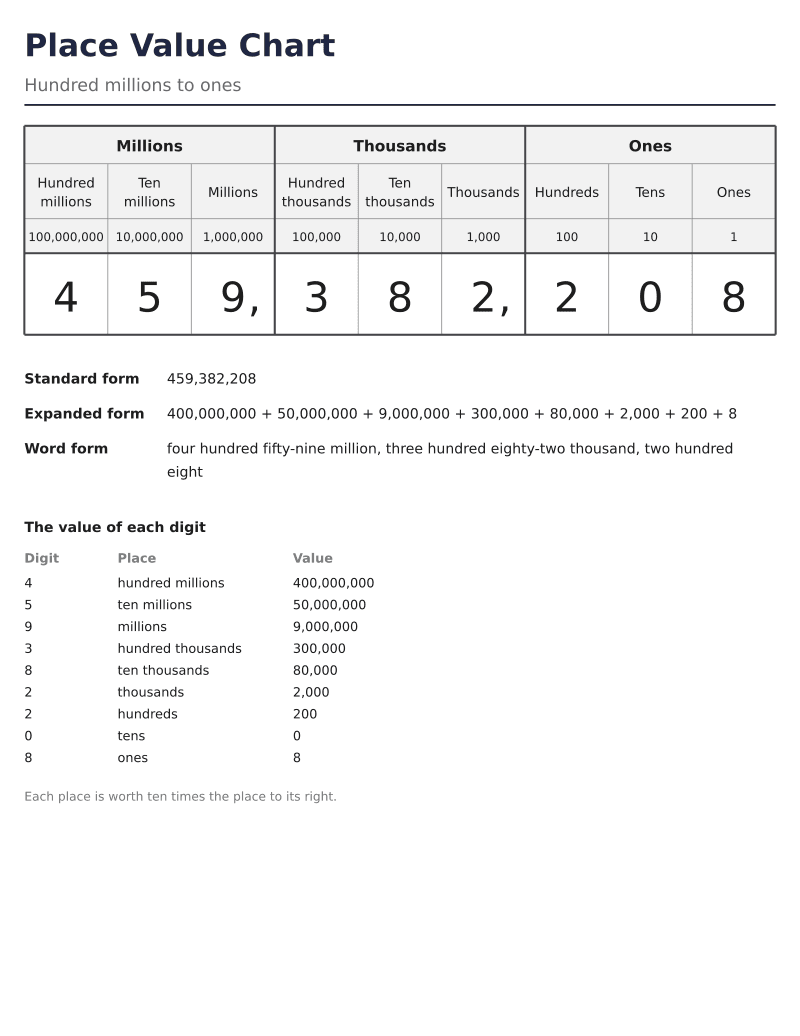 Place value chart to millions9 columns · names, values and an exampleDownload PDF ↓
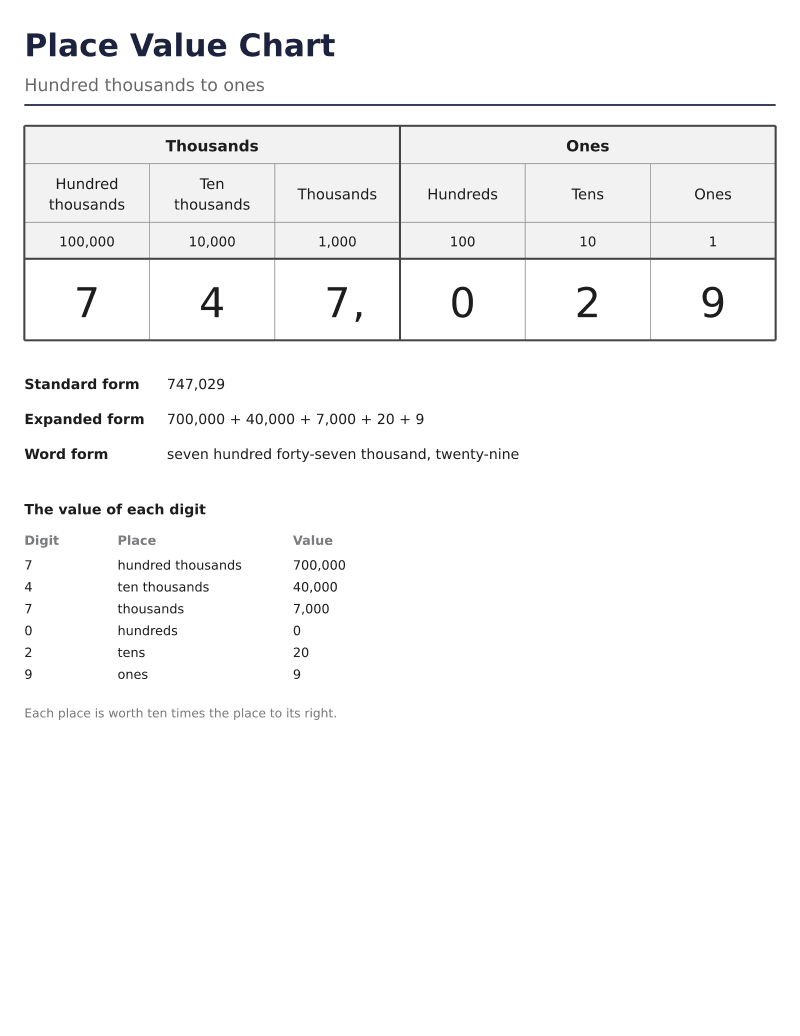 Place value chart to thousands6 columns · names, values and an exampleDownload PDF ↓
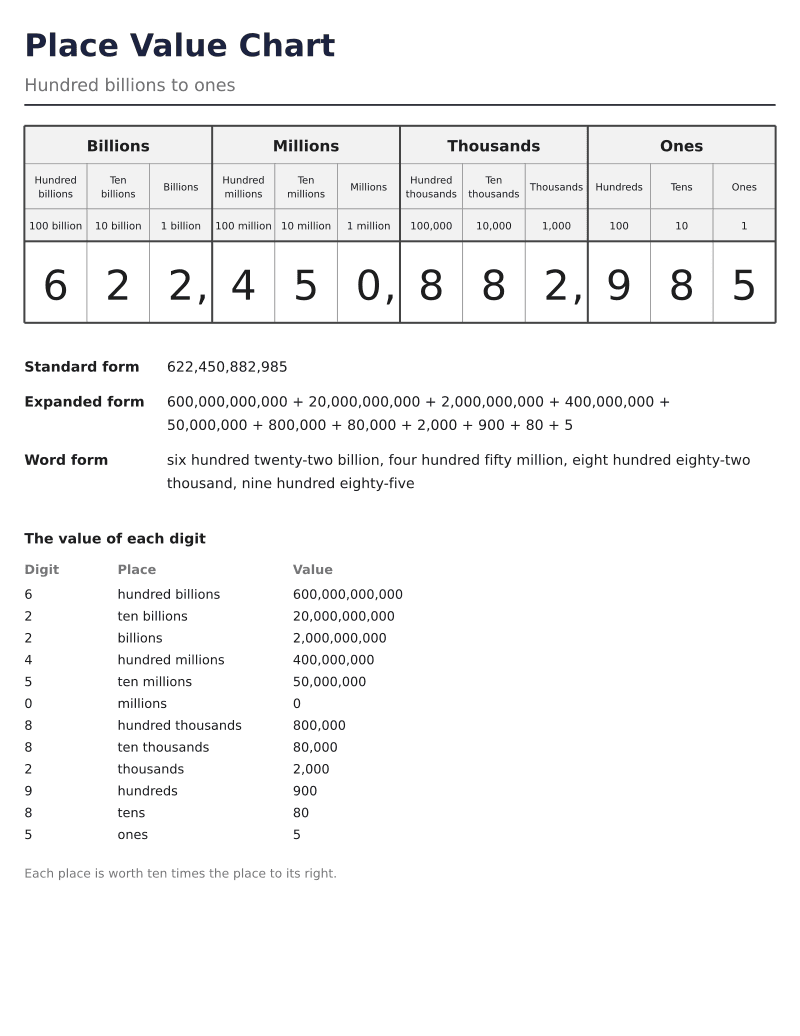 Place value chart to billions12 columns · names, values and an exampleDownload PDF ↓
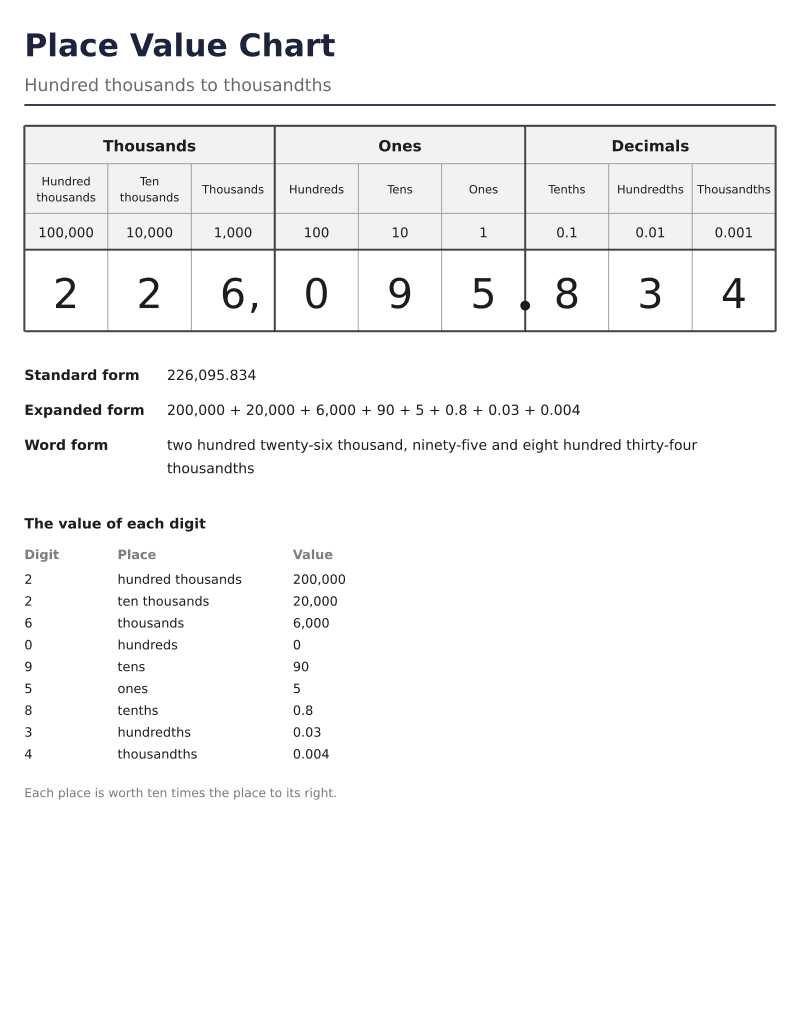 Place value chart with decimalsHundred thousands to thousandths · 9 columnsDownload PDF ↓
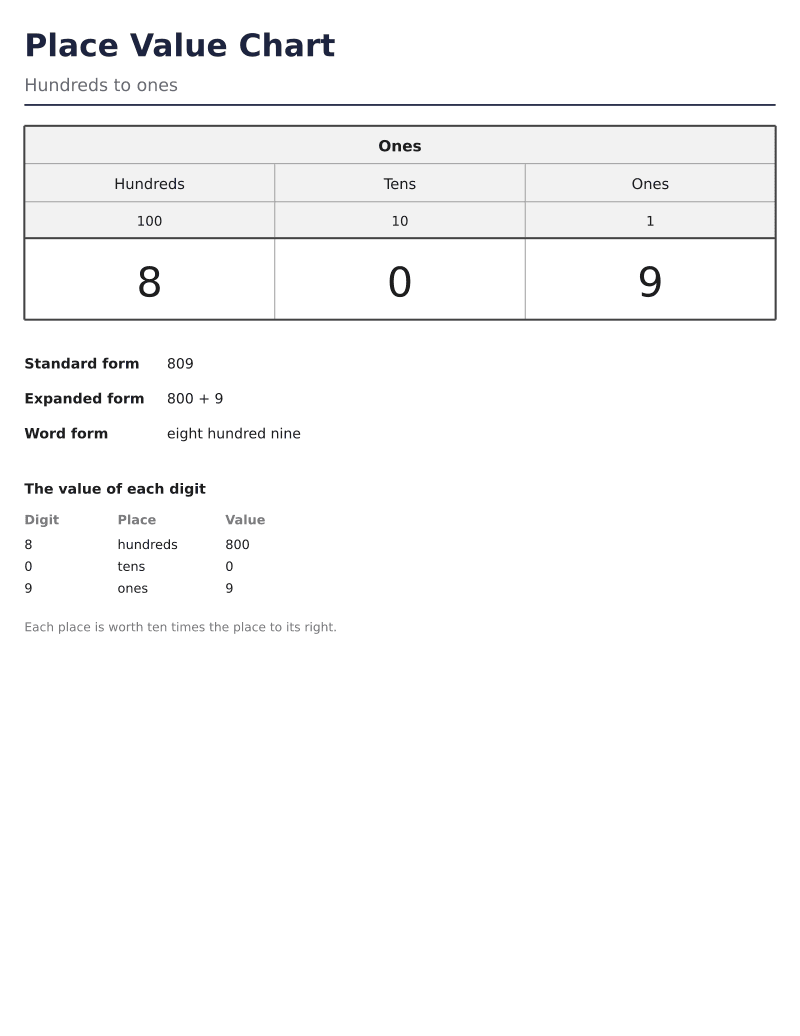 Place value chart, hundreds, tens and ones3 columns · names, values and an exampleDownload PDF ↓
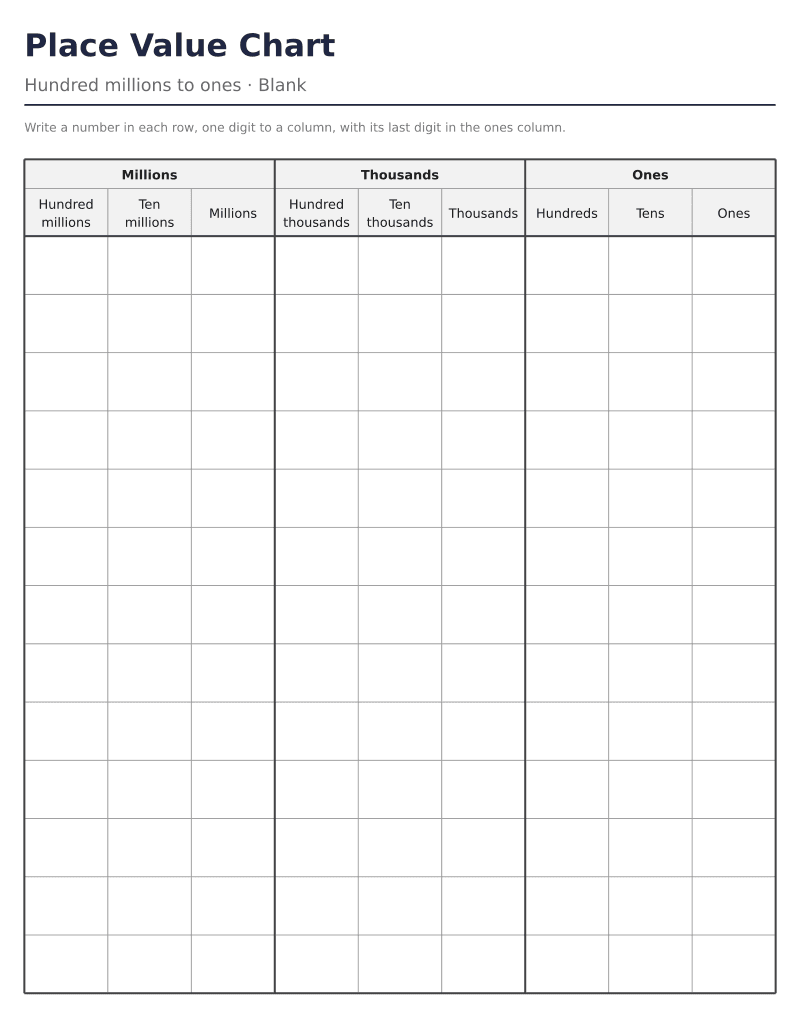 Blank place value chart to millions9 columns · 13 empty rowsDownload PDF ↓
Every sheet here is free to print as often as you like. If one saved you time, the tip jar is on Ko-fi.
Place Value Chart
Hundred millions to ones
Created for free at puzzleandprint.com
The filled chart is one US Letter page. Across the top, each period has its name over its three places: Millions, Thousands and Ones on the chart to millions, in bold on a faint gray wash. Under that every place is named in full, Hundred millions, Ten millions and Millions down to Hundreds, Tens and Ones, and under each name is what a 1 in that place is worth, from 100,000,000 down to 1. Heavier lines mark the outline, the line under the names and values, and the edge of every period, so the groups of three that commas make in a written number are the groups the chart is drawn in.
Below the names, one number is written into the chart as an example, a digit to a column in large type, with a comma after the digit that closes each period, as the number is written. On the chart to millions it is 459,382,208, the same number every time that chart is printed. Under the chart the same number is set out in standard form, expanded form and word form, then in a table that gives every digit its place and its value, the zero included, and last the line every chart is built on: each place is worth ten times the place to its right.
Every chart prints 182 mm wide, about 7.2 inches, so the columns narrow as the chart grows: about 61 mm each on the hundreds, tens and ones chart, 30 mm on the chart to thousands, 20 mm to millions and 15 mm to billions. The names are set as large as the widest name in the chart allows, one size for all of them. On the chart to billions the values of the millions and billions places print as 1 million up to 100 billion, since 100,000,000,000 would not fit a 15 mm column at a size anyone could read; every other chart prints its values as numbers. Nothing is printed in color.
The maker draws whole periods, because a period is the group a comma closes: hundreds, tens and ones alone, the chart to thousands with six places, the chart to millions with nine and the chart to billions with twelve. Any of them but the last can carry on past the decimal point to tenths, hundredths or thousandths, under a heading of Decimals. The point itself is not a column. It is printed as a dot on the heavy line between the ones and the tenths in every row a number goes in, so a decimal written into the chart lines up on the point without anyone having to say so.
The chart to billions is whole numbers only. Twelve columns already fill the width of the page at 15 mm each, and three decimal places would make fifteen columns of 12 mm, too narrow for "Thousandths" to be printed at a readable size. The widest chart with decimals runs from hundred millions to thousandths, also twelve columns, and its names are set at 6.9 point, the smallest on any chart here.
Any chart bigger than hundreds, tens and ones alone can shade every other period in light gray: the thousands, the billions and the decimal places, leaving the ones and the millions white. On a long chart it helps the eye stay in one period while reading across it, and the gray is light enough to write on and to photocopy.
Practice sheets come in three kinds. The first lists ten numbers above an empty chart and asks for each to be written into its numbered row, one digit to a column. The second asks for each number in expanded form, the value of every digit added together, and the third for each number in words. Each has an answer key on the next page unless you switch it off: the chart with every number written in, or every answer written on its lines, in a lighter gray than the printed numbers. Like every key on this site it prints plain, with no border.
The numbers sit near the top of the chart they are for, but not all at the top: on the chart to thousands they have four to six digits, to millions seven to nine and to billions ten to twelve, with every length used before any repeats, so the numbers start in different columns and the child has to count back from the ones to place each one. On a chart with decimals each number has from one decimal place to as many as the chart has. At least two numbers on every sheet hold a zero, as in 40,306 or 0.07, and no number appears twice.
Every sheet is made from a seed, so New numbers makes a different one whenever it is pressed and the versions setting puts up to five different sheets in one PDF, each followed by its own key. An expanded or word form sheet gives each number as many ruled lines as the longest answer on that chart could need in a child's handwriting, so it holds ten numbers to thousands in expanded form but four to billions in words.
A long number is read one period at a time, from the left. Read the three digits of the first period as an ordinary number, say the period's name, and move on: 459,382,208 is four hundred fifty-nine million, three hundred eighty-two thousand, two hundred eight. The commas fall exactly where a period ends, which is why the chart groups its columns in threes and why the word form keys put a comma after each period's name. A period of three zeros is skipped in words, so 5,000,017 is five million, seventeen.
Two rules trip children up and are worth saying before the first practice sheet. In whole numbers there is no "and": 305 is three hundred five. In a decimal, "and" is the point and only the point, and the last place names the unit, so 4.06 is four and six hundredths. And a zero is never left out of the digits, because it is what keeps every other digit in its place: without the zero in its thousands place, 40,306 would be 4,306. The word form keys follow these rules, and so does the example on every filled chart.
Each page has six ready-made sheets to print, plus the maker above opened on that kind of sheet.
Yes. Every chart at the top of this page and every chart or practice sheet the maker makes is free to download and print as often as you like, at home or for a whole class. There is no sign-up, no email address to give and no watermark on anything printed.
One US Letter page, with the chart 182 mm, about 7.2 inches, wide whatever its size, so the columns are about 30 mm wide on the chart to thousands, 20 mm to millions and 15 mm to billions. It also prints on A4 at 100%, since the chart is narrower than an A4 page and Letter is the shorter sheet.
Because twelve whole places already fill the page. Adding tenths, hundredths and thousandths would make fifteen columns about 12 mm wide, and a name like Thousandths could not be printed in one at a size anyone could read. Every smaller chart, up to hundred millions, can carry all three decimal places.
As the value of each digit added together, largest first, with any digit that is a zero left out: 40,306 is 40,000 + 300 + 6, and 4.07 is 4 + 0.07. Some classes write each part as a digit times its place instead, 4 × 10,000 + 3 × 100 + 6; the key does not, so mark that form as right too if it is the one your class uses.
Because US classrooms keep "and" for the decimal point. 305 is three hundred five, and 305.4 is three hundred five and four tenths, so the word tells a reader exactly where the whole number ends. The keys also hyphenate twenty-one to ninety-nine and put a comma after each period's name, as most US textbooks do.
Yes. Choose Hundreds, tens and ones under Places for a chart of three wide columns, about 61 mm each, filled, blank or as practice. The practice sheet for it gives ten numbers of two or three digits to write into the chart, which suits second grade, and the filled version is one of the ready-made charts at the top of this page.
New printables when they go up, mostly seasonal, a few times a year.